")
From a limping Europe to an apparently sluggish US to a speculative China, market uncertainty abounds. The past year has been a time of great test for both the big boys of America Inc. and Wall Street. The worries aren’t over yet. Just like in 2012, brains in America’s boardrooms are still anxious about themselves and their shareholders – what their bottomlines will look like after a year of toil when 2013 ends, and what satisfaction the harlot-of-a-market decides their shareholders can take home. These are nervous times still. Yet, there is hope.
There are signs.
America’s benchmark indices have given some comfort to both value-bent and pessimistic investors in the past year. After hitting a 12-month low of 1131.42 points in July 2011, the S&P 500 hit the highest ever mark in its 63 year-old history of 1,530.94 on February 19 this year (surpassing the previous highest of 1526.75 points achieved precisely six years back). And it would be safe to say that there has been no looking back for this index. Today (as on July 29, 2013), at a never before seen peak of 1685.33, it looks delightful to speculators. The stories of NYSE Composite and NASDAQ Composite indices are not very different.
Post a 14-month low of 6791.65 points in July 2011, the NYSE Composite has risen to 9571.79 – in spitting distance from its all time high of 10,039.28 points recorded in July 2007. The NASDAQ Composite after dropping to a 12-month low of 2415.40 points in July 2011 has moved cautiously uphill. At 3599.14 points today, it may be many blocks away still from the peak of 4572.83 it touched in the January of 2000, but the index has never spiked to this extent in the past 13 years! “Astounding” is the word to describe the manner in which these indices broadly seem to be indicating the enormous backup job that America Inc. is doing to clean up litters of the previous bubble disaster. Calling the ongoing work of corporations across America “disappointing” would therefore seem unromantic.
The indices however seem to be magnifying the operational outcomes of America Inc. Not that their winning strategies are out of place, but making a handsome bundle in the war against inflationary pressures and creating incredible margins is just not happening. Not in a big way. As compared to the 2012 B&E US Power 100 companies (list of the top 100 profit makers in US in 2011), the 2013 B&E US Power 100 army has just grown its profits by 2.5%. That’s not encouraging when you compare it to the 13.4% growth that this group reported 12 months back.
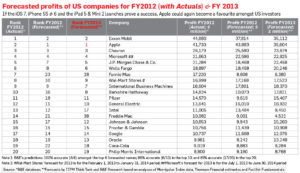
A word on the forecasts. When B&E came out with its prediction of the 2013 B&E US Power 100 in July 2012, it had identified the top 20 profit-making American companies for 2012. Turns out, 17 of the 20 companies that actually became the highest profit makers in US were a part of B&E’s predicted top 20 list. In fact, the top 4 spots belonged to those who B&E had predicted would take them.
Something better still. On the basis of shareholder wealth creation. B&E’s predicted list of top 20 US profit makers actually created 49.29% higher shareholder value than the actual top 20 profit makers. To compare – the top 20 predicted profits makers saw their combined m-cap rise by $769.951 billion in the past five quarters (between Q1, 2012 and Q2, 2013) as compared to the $515,739 billion increase recorded by the ‘actual’ top 20 bottomline creators. In short, if an investor had invested $100 on the portfolio of actual top 20 profit makers a year back, today, he would have a total of $113.56 with him. The same investment on the portfolio of profit makers suggested by B&E would have grown to a higher $120.24. To repeat: B&E’s predicted list of top 20 US profit makers actually created 49.29% higher shareholder value than the actual top 20 profit makers in the past 15 months – one reason to look out for B&E’s prediction of the top profit makers for 2013. [Ed’s note: Of the 3 companies that weren’t a part of the predicted top 20 profit making list (and were a part of the Actual top 20 profit makers list), one, Coca-Cola destroyed the highest amount of shareholder wealth amongst all B&E US Power 100 2013 companies in the past 15 months ($129.26 billion), and two others, the Fed-owned Freddie Mac and Fannie Mae are of little interest to ordinary investors and could get delisted any time there is a problem in the US mortgage industry or the economy at large.]
An expression of the volatility of the B&E Power 100 list in the present times is that more than a fifth (21%) of names on the 2013 B&E US Power 100 list are new. Fresh legs, but it’s debatable whether they can run for 12 months at a stretch because given the cyclical nature of the present global economy – with every sector reporting danger signs now and then – old names will think they have a good chance to get back into the top 100.
Interestingly, this year, eight (43%) of the 21 new names who made it to this year’s list are from the financial (BFSI) vertical (includes Fannie Mae, Freddie Mac, Bank of America, State Farm Insurance Cos., Travelers Cos., State Street Corp., Allstate, MasterCard, and Aflac Inc.). You could even therefore term it the comeback sector of 2012. Shale gas boom in the domestic US market saw profits of oilcos dip – one reason why ExxonMobil failed to rewrite its own profit record set in 2008 (though it clinched the top spot this year too), and others like Marathon Oil and Devon Energy made their way out of the B&E US Power 100 list this year.
Inorganic activity (including spin-offs and M&As) was also common in America in 2012. And this has had a fair impact on the B&E US Power 100 list this year. We cite three of them.
Two new entrants stormed into our list this year after being spun off from their parents. Phillips 66, the refining arm of ConocoPhillips was spun off into a new company and debuts at no.46 on this year’s list with profits of $4.124 billion in 2012. [Its parent ConocoPhillips – which in its altered avatar is no longer an integrated petroleum producer as ConocoPhillips only focuses on the higher margin business of exploration, drilling and production – occupies the no.21 spot.] Another spin off that made it to the B&E US Power 100 list is Mondelez International, at no.59 with a PAT of $3.028 billion. Sounds unfamiliar a name? Actually, it is a streamlined version of its parent Kraft Foods.
Mondelez will only market the snacks parts of Kraft’s business (including Oreo cookies and Cadbury candy bars), while the other arm named Kraft Foods that currently specialises in groceries and beverages (an entity which was at no.55 last year) made its way out of our list. The third spinoff was that of Huntington Ingalls Industries that was floated as a separate entity this year (a cut-off from its parent Northrop Grumman). In the previous year, Northrop Grumman was the second last name to feature in our Power 100 rankings. This year, it shed a profitable arm (Huntington which made $146 million by selling aircraft carriers, destroyer aircrafts and Coast Guard cutters) and missed the #100 spot to Viacom by a relatively small margin of $3 million (Northrop Grumman made $1.978 billion in profits in 2012).
The B&E US Power 100 list is always as interesting as it is intriguing. Why do some companies lose out on their profit-making ways? Why do some industries welcome a new year like an oxygen mask in the darkness of space? To talk about more recent times, polarisation in American politics has taken its toll on companies and the half measured pump-priming has ensured that despite a double-digit rise in profits of top 100 profit makers in 2011, 2012 saw a sub-3% growth. But thankfully, even in such an ecosystem, boardrooms in America are still thinking of how the programmed for ‘a binary mode of thinking’ investors can be lured by a higher-than-ever profit base. [You don’t need investment science to explain why profit making companies – that beat analyst estimates – more often than not avoid receiving the ‘stick’ at the bourses.]
For both class of investors in the American stock market – the adventurous lot and those secure in their own skins – like the previous two years, I bring for the third time in a row, an indicative guide to which companies they should bet on for the next 12 months. My forecasts in the previous two years have beaten the actual best in the business of profit making. It’s not a claim – numbers luckily have worked. So have my careful calculations. Yes, the accuracy hasn’t been 100% [I’m no Oracle!]. I forecasted Apple to walk away with the crown this year, but disappointing iOS 6 enhancements, failures like the Siri and Maps, and slowed down sales of the iPad caught me on the wrong foot. But despite actual profits falling short (by $2.15 billion as compared to our forecast), Apple still came in second behind ExxonMobil (our predicted no.2), which clinched the US B&E Power 100 title for the second year in a row. But like we said before, those who would have trusted my pack of top 20 profit makers [forecasted in July 2012] to put their money in during a volatile environment, would have walked away with a 20.24% return in under 15 months. Not bad if your life’s work and earnings are to be measured by one simple number.
2013 will be a new year for the victors of the past and challengers who failed to make the cut into the B&E US Power 100 rankings this year. And by the time we hit the middle of 2014, B&E will present to you the third edition of its US Power 100 list – the 2014 B&E US Power 100, featuring the 100 highest profit makers of America Inc. for 2013. But we will stick to our practice of focusing on the top 20 corporations that have the potential to give back maximum rewards to believing shareholders. So two questions remain – How did the top earners on this year’s list actually get to the top? And who will occupy the top spot when this list becomes public next year?
Last year, ExxonMobil made it to the top of the list of top profit makers in America for the 10th year in a row. As such, getting attention has never been the issue with Exxon, which is today also the most valuable company in the world (with an m-cap of $417.11 billion, as on July 31, 2013). The company recorded the second-highest profits in its history in 2012 ($44.88 billion, which was also the 2nd-highest in the history of mankind; the highest also by Exxon in 2008 of $45.22 billion). More than absolute value, it is the jump in profits of 9.30% y-o-y that makes Exxon’s 2012 performance remarkable. Why? Because Exxon achieved the growth in bottomline despite problems on the exploration (crude oil production) front and by betting on refining that has for long been considered a drag on earnings by experts. During 2012, the Irving-based energy giant’s oil and gas production actually fell as compared with 2011 totals. Globally, net liquids production fell y-o-y by 5.5% to 2.185 million barrels per day (bpd), and natural gas production shrunk by 6.38% to 12,322 million cubic feet per day. However, while weaknesses on the upstream front – that has only grown over time – was exposed to a greater extent during the year (something that we mentioned even last year), the company managed profits (that were higher than the previous year) due to decreased cost in the company’s natural gas business, asset sales and stronger performance in the company’s oil refining (downstream) division. While earnings from Upstream and Chemical businesses fell by 13.19% (to $29.895 billion) and 11.07% (to $3.898 billion) respectively, a fat rise of 195.81% in margins (to $13.190 billion) in the Downstream (Refining) arm and high net gain on asset sale of $13.018 billion (a y-o-y rise of 358.06%) made its year worth the count. The company also gained from the abundance of cheaper domestic energy, with a greater supply of crude and natural gas in US driving operational costs down y-o-y by 3.83% to $70.126 billion in 2012. Trick: with supplies closer home, making and selling fuel got cheaper for Exxon! As for the coming year, Exxon’s Upstream problems will continue, and asset sale gains will at best fall to ordinary levels (in the range of $1-3 billion). With gas prices stabilising further and domestic production of crude set to increase, its profits will take a hit. There are some positives and negatives for Exxon going forward. Positives: (a) The company’s E&P activity is still geographically diversified (across 21 countries) with over 81% of its net oil production, and 69% of its natural gas production happening outside US; (b) Its earnings are also not totally exposed to demand shocks in a restricted geography like US. In 2012, 73.92% of its total profits across all three functional arms (Upstream, Downstream and Chemicals) came from 99 markets outside US; and (c) Reduced debt levels (that fell by 32% y-o-y in 2012 to $11.581 billion), an improved debt to capital ratio of 6.3% (as compare to last year’s 9.6%), and a huge cash pile of $9.58 billion add to the company’s strength.
There are reasons for worry though – the negatives. At present, Exxon accounts for 3% of the total fuel (oil & oil-equivalent of gas) produced around the world. As per the US International Energy Agency (IEA), it is healthy for the oil major to spend in excess of $9 billion each year on R&D costs to pump more energy into its upstream activities. At present, Exxon is investing just above $1 billion (in 2012) in R&D. Until this is worked on, the company’s undeveloped and unproven gas reserves will not be exploited further therefore creating greater pressure on the supply front. Currently, 45.86% of the company’s oil reserves and 32.17% of its natural gas reserves are undeveloped. Big chunks and all the most important to be considered during times when easy oil is increasingly getting rare for Exxon. Supporting out argument, Chicago-based Erik Kobayashi-Solomon, Market Strategist & Global macro and sector investing expert, Morningstar Inc., tells B&E, “Exxon Mobil significantly increased its exposure to natural gas, and North American natural gas prices are presently just coming off of a 10-year low. Until price for natural gas rises, this part of Exxon Mobil’s business is like to lag in profitability. Regarding oil, all the ‘easy oil’ resources has been exploited. Now, the most promising reserves are much more costly to extract, process, and transport. If the cost continues to increase (as is likely) and price falls or stays steady, profitability of Exxon should fall.” Finally, Exxon’s exposure to movements in the price of crude, that affects close to 30% (29.39% to be precise) of its bottomline exposes its biggest weakness – overdependence on a core business. A slowdown in energy markets can play havoc and Exxon’s position could become weaker in future if that were to happen. As per EIA, the average price of crude (WTI Spot Price/barrel), after averaging more than $102 during January-April 2012, will fall to just above $90 in 2012 and 2013. It also predicts a reduction in the average price of natural gas from the current $11.37 per thousand cubic feet to under $10.50 during 2012 and 2013. Based on our analysis of Morningstar Index data, Thomson Financial estimates and FactSet Fundamentals in the backdrop of the overall global macroeconomic and company-specific expectations for 2013, we estimate that Exxon Mobil’s profits will see a decline of 21.76% to $35.112 billion in 2013. It will find grabbing the #1 spot in next year’s US Power 100 list a tough task.
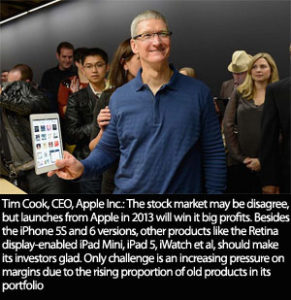
Apple on the other hand, despite all the bad press over its falling market value and lack of pathbreaking product launches (like the iCloud, iOS 6, Siri, Maps and many more) should find enough willing buyers to serve its high margin phone business even in the year to follow. In 2012, the company’s iPhone and iPad businesses flourished. While iPhone unit sales grew by 73% (to 120.46 million) that of the iPod grew by 80% (to 58.31 million). Of course, the company would have desired more from its desktop and portable PC categories. While sales of desktops – includes iMac, Mac mini and Mac Pro – were flat (at 4.656 million units), the portable unit – includes MacBook, MacBook Air and MacBook Pro – recorded a 9% jump in unit sales to touch 13.502 units. But given the high margin business of iPhones (average margins of 45-55%) and iPads (35-40%), Apple would bother little about the stagnating PC category. Over the past three years, the company’s gross margins have marked a steady rise – from 39.4% in 2010 to 40.5% in 2011 and to 43.9% in 2012. The net margin improvement has been remarkable too – from 21.5% in 2010 to 23.9% in 2011 and to 26.7% in 2012. What is most encouraging about Apple’s performance in the previous year is that its revenues and profits were geographically diversified. While 37.3% of its profits last year came from the Americas, 23.6% came from Europe, 9.29% from Japan, and 22.37% from other APAC markets including India and China. The growth in net sales during 2012 across all regions was primarily due to increased demand for iPhone (iPhone 4S, iPhone 5), and the new iPad and iPad 2. In fact, in the APAC region, higher Mac sales made the company’s PC business appear strong. Apple’s iTunes store is also growing into a major topline earner for the company. Last year, sales of music-related products and services alone stood at $8.5 billion – a y-o-y growth of 55% and accounting for 5.5% of its topline! The company is also on a serious expansion spree. As it reported in an SEC filing, Apple has also increased its employee count to 76,300 – a rise of 26.32% in just a year. And it also added 33 new retail outlets this year, of which 85% were opened outside US. When 2012 ended, the total retail store count had touched 390.
So what does 2013 promise for Apple? As per a June 2013 estimate by Gartner Inc., Apple’s combined share of mobile phones, tablets and PCs will grow from 9.6% at present (as of end-2012) to 12.62% by end-2013 and to 14.16% by end-2014, and the company will ship almost 296.36 million devices this year, a count which will rise to over 354.85 million during 2014. Another estimate by Canaccord Genuity is that Apple will sell 101.6 million iPads in 2013, giving Apple a 58.4% command over the tablet market. As far as the smartphone market is concerned, the company is expected to sell 193.9 million units of iPhones in 2013. If this be the sweet truth, Apple’s profit track will only continue to bloom.
The only worry with Apple at present is that its growing mix of older and cheaper products – and that includes the iPhone 4, iPhone 4S, iPad and iPad mini, will weigh heavy on the company’s profit. And we will be surprised if Apple completes 2013 with an operating margin in excess of 40%. The plethora of new launches from Apple’s stable (all of which will bear the premium price tag, of course!) should however ensure that the company completes 2013 with a gross margin of over 35%. The two iPhones that will be launched this year (the successor to the iPhone 5 called the iPhone 5S, and a new low-cost iPhone made for emerging markets that will be called either iPhone Light or iPhone 6), the iOS 7, Mac OS X Mavericks, iTunes Radio (which will probably be called the iRadio), iPad 5, iPad Mini 2, the much awaited iWatch and perhaps even a TV, could make Apple the darling of the stock markets yet again.
How healthy is Apple? As per Moody’s estimates, Apple’s cash reserves are slated to cross $170 billion by end-2013. We are talking about a zero-debt, conservative company – that believes in maintaining truckloads of cash and is at present in a position to leverage its debt capacity at any given hour. With the right focus on costs and profits and without losing sight of the right market segments, Apple can rise up to the #1 spot in terms of profitability next year. The company besides its new launches should however plan right for the right markets, as NYC-based Credit Suisse analyst Matthew Cabral tells B&E, “In 2013, we estimate that the average middle-class American will spend $417 per year on Apple products, which will rise to $500 by 2015. Importantly, by 2015, there will be 244 million consumers in emerging markets with similar income profiles, up from 133 million in 2011. Assuming Apple addresses these markets from a distribution perspective, this could drive an incremental $89 billion in sales and $21 of EPS by 2015. India, China, Brazil Russia and Mexico will account for 70% of this incremental revenue opportunity.” Our calculation is that pressures on its bottomline will reduce earnings by 14.69% in FY2013 to $35.60 billion – a fall yes, but adequate to make it the new no.1. What Apple did to Exxon Mobil’s m-cap in August 2011, it can do to the oil giant’s profit figure this year.
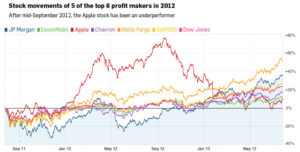
There are many other corporations that hold much promise for 2013 on the B&E US Power 100 list. Chevron is one name that can’t be missed. Last year, when integrated oil giants were being forced to relook their refining business in the wake of increased domestic supply and stabilisation of crude oil prices, like Exxon did, Chevron held onto its refinery business to push forward its profits. It paid off. With a bottomline of $26.179 billion, the oil major came at #3 on this year’s list. Thought this marked a 2.66% fall in annual profits, what is commendable is that Chevron, like Exxon took maximum advantage of domestic supply helping lower its costs. Despite earnings of the company’s upstream business falling by 4.03% to $23.788 billion, its nimbler upstream (refining) business saw margins rise by 19.72% to $4.30 billion in 2012. And this saved Chevron’s day despite overall group revenues falling by 5.64% to $230.59 billion. In 2013, we wait and watch whether Chevron’s big bets on upstream investments like natural gas exploration works. It hasn’t yet. Moreover, if profits continue to shrink like it did this year, the company could well be on its way to being acquired by another entity. The company has to understand that 88.67% of its revenues come from refineries and fuel stations, and if the company doesn’t hedge itself from shocks in a particular market, like the softening of fuel prices in the past 12 months, it could be in for some rude treatment from shareholders. So what can Chevron do – diversify geographically as Exxon has. At present 47.64% of its downstream profits come from America. It’s time Chevron thinks about getting into fresher, emerging markets, where demand softening will not be heard in at least a decade. If the company continues treading on the old path, despite a huge bank of $20.94 billion in cash and cash equivalents and another $21.0 billion in accounts and notes receivable, the company’s profits will fall below the 2012 levels if oil prices fall below the $88/barrel mark. Bad news that is bound to happen. With forecasts revealing that price of crude could fall further by 5-10% during FY2013, Chevron will have a hard time answering investors. Our prediction is that Chevron will witness a 9.57% dip in net profits in 2013 (to $23.674 billion) – only just enough to put it ahead of the #4 predicted Microsoft. 2014 will be far more challenging for this oil major.
 Amongst IT giants, relative to 2012, this year again looks most promising for Microsoft. Microsoft saw a 28.77% jump in its bottomline during FY2012, primarily due to excitement surrounding (and initial successes of) new launches like the Windows 8 OS, Windows Server 2012, Visual Studio 2012, Surface tablet, and Windows Phone 8 OS. In under a year of its launch, the Windows Phone 8 OS has already made inroads into the global smartphone market. Today, Microsoft’s OS runs on 3% of the world’s smartphones, and the numbers are only expected to rise as more bugs are fixed and Nokia steadily rediscovers its lost charm. With Gartner forecasting Microsoft OS to capture 19.5% of the global smartphone market by 2015 (with 216 million handsets sold that year being Windows OS based; behind Android’s 48.8% and ahead of iOS’ 17.2%), 2013 and 2014 appear to be high growth years for the company’s mobility business. A lot is also expected from the company in the hardware space in 2013. Reason: its entry into the tablet market is based on a new OS – the Windows 8 Pro. What would prove ideal for the company would be the adoption of its radically new, exciting OS across all platforms on the desktop and portable categories. There is better news still if we consider the overall device market. In Q4, 2012, Gartner forecasted that the total installed base of Microsoft Windows 7 & 8 OS-powered smartphones, PCs and tablets would reach 2.284 billion units by 2016 – just behind the count of Android devices at 2.299 billion units. In short – Windows 8 will be the 2nd-highest sold OS in the smartphone category and the 3rd-highest in the tablet market by 2016.
There are a few challenges going ahead for Microsoft. Presently, it commands 91.51% of the world’s desktops (as per Net Market Share, June 2013 report). That has two consequences. One is that PCs are a dying category, sales of which will shrink y-o-y by 10.58% in 2013 (to 305.178 million units) and by 5.22% y-o-y in 2014 (to 289.239 million units) – not a happy picture when you consider that the company earns 85% of its topline from this category. Two, as three independent studies indicate (StatCounter monthly report June 2013; W3Counter Global statistics report June 2013; and Wikimedia Traffic Analysis Report – Operating Systems, June 2013), except Windows 8 OS, all other Windows platforms have seen their market shares fall by big double digit percentage points in the past 12 months. Also, there is much doubt over the quick adoption of the new Windows 8 OS on which the company has bet much of its future earnings. Writes Prof. Rosabeth Moss Kanter of Harvard Business School in an HBS Working Knowledge article titled, ‘10 Reasons Customers Might Resist Windows 8’, “Give Microsoft credit for innovation. But will customers rush to embrace the change, or will they resist it at first? Signs point to resistance. Even in an era where young techies are looking to get the hottest and latest, people are resistant to change. Software is the method by which people do their work, and if you’re requiring a radical change in how they do their work, it’s a lot to ask. There will be questions about Windows 8. ‘Will it work?’ ‘Will it help me?’ ‘Will this require further upgrades as Microsoft fixes the bugs?’ People might wait until there’s more certainty, reasoning that if the current software works well, then why should they change?” In Windows 8 there’s the tile interface, there’s no more start button, there’s the ‘Charm Bar’ et al.
 These tools may work well, but human psychology says that if it’s too different and too jarring. Even the Microsoft Surface RT tablet hasn’t found many fanboys yet. In October 2012, when Microsoft launched the new tablet PC, the Surface RT, observers claimed that it would give the Apple iPad a tough year ahead. That has not happened yet. Microsoft’s Entertainment and Devices division is yet another area where Steve Ballmer will have to focus. The Xbox 360 platform that contributes to 84% of this division’s topline witnessed a 1% fall in revenues to $8.045 billion in 2012. And not much can be expected in the name of a pleasant surprise from unit with even the newly launched Xbox One proving a disappointment (gaming veterans are recommending the cheaper, graphically superior and more compact Sony PS 4 over the Xbox One). Finally, the company’s Online Services Division (OSD) that has burnt more than $12 billion over the past three years, is expected to lose money in 2013. OSD offers Bing, Bing Ads, and MSN – three platforms that should have ideally thrived on search and display advertising. Therefore, that this unit is losing money only goes to show how weak Microsoft still is in the Online services space. [If you recall, even in 2011, the company suffered a $6.2 billion hit in the final quarter for being forced to write off its bet on online ad unit aQuantive.] Where Google and Facebook are flying, Microsoft is crawling. For this business, a turnaround is only expected post-2014, and that if Bing isn’t closed down for lack of performance. Another problem that Ballmer has to treat, and very soon is the slowdown in the Microsoft Business Division (that offers the Microsoft Office system and Microsoft Dynamics business solutions). Why? Because this division accounts for more than 37% of his company’s topline and 60% of its bottomline. But last year hasn’t been good, with both topline and bottomline of this division being drags – while revenues climbed just 2.54% to $24.72 billion, profits managed just 2.29% (to touch $16.19 billion). Ballmer would definitely want to see his biggest cash cow gaining weight at a faster pace.
Despite challenges, we expect the recent ‘Microsoft One’ reorganisation war cry worth the press attention. The strategy should help realign the company to be able to introduce effective innovation within its unified walls (with the company being divided on the basis of functional departments rather than business divisions). No longer will the Xbox and Windows divisions be functioning as two separate companies. Like Jobs did to Apple in the four years leading to his departure, Ballmer is trying to configure Microsoft as a company with One DNA! The union should help reduce costs and get motivation levels up besides making target meeting a more serious exercise at the company. Our prediction is that in 2013, Microsoft’s profits will grow by 4.4% to touch $22.825 billion, making it the no.4 yet again, and the second-most profitable amongst technology companies in 2013.
During the downturn, one industry took the maximum hit – financial services. When report cards for 2012 came in, one could sit back and comfortably say that this lot has finally rebounded. As compared to the previous year, the 2013 B&E US Power 100 has 67% more names that belong to the BFSI vertical. Clearly, the sectoral might has shifted towards this group. America’s biggest BFSI vertical corporations – J.P. Morgan Chase (at no. 5 on the 2013 B&E US Power 100), Well Fargo (no.6), Citi (no.23), U.S. Bancorp (no.35), Bank of America (no. 44) and many others – reported huge profit gains as compared to the previous year due to an encouraging rise in mortgage originations in America’s fast-improving housing market.
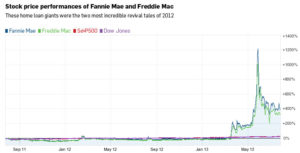
The biggest surprise however was when we found two most unexpected names on this year’s US Power 100 list – Fannie Mae (at no.6; PAT of $17.220 billion) and Freddie Mac (no.14; PAT of $10.982 billion). These home loan giants were one of the most often and biggest names cited as triggers that led to the global meltdown that occurred four years back. Together, in the four years leading to FY2011, they lost a total of $258 billion. In 2012, together they made a total of $28.202 billion. Again, their revival came due to a combination of rise in mortgage deals in US (understandable, with the US housing market improving in 2012) and corrected lending standards (that enabled them to replace bad loans with better-quality mortgages).
When 2013 comes to a close, and we return with our US Power 100 list again next year, there might occur big changes in our list. Much representation of the BFSI industry in this year’s list could go missing – that will happen if the mortgage lending market slows down in US (that has already started in Q2, 2013). Also, if interest rates remain low, bankers and loan providers will feel the pinch.
The Retail industry could also see payoffs reduced if sluggish sales that began in Q1, 2013, becomes a permanent feature for the remaining three-fourths of 2013. With consumers being hit due to higher payroll taxes and rising fuel prices in the first quarter and with costs only heading northwards for companies, not just retailers but even the Entertainment and Travel and Hospitality verticals could be adversely affected. And those in the technology world might just see better days due to social networking and convergence coming into play (like Intel, Amazon.com, Qualcomm, Facebook and Yahoo!), or simply because they don’t repeat mistakes of the past (like HP). In 2012, America’s 100 most profitable companies set a new benchmark in profit-making. Given the slow recovery and a confused, cash-strapped consumer lot, that was encouraging. But what worked in 2012 may not work in what remains of 2013.
Inconceivably marvellous new products, geographical diversification, radical technology enhancement, an outlandish spinoff, or plain, simple luck – whether it be Big Oil, a submarine supplier or a smartphone seller, a corporation that makes it to one of the top spots on the list of 100 most profitable names in America Inc. next year will have one or some of these forces in place to support its cause.
Actually, we already know a handful of such names. Don’t we?